Tuesday, May 09, 2006

Marin in the News

I would have posted this earlier but Blogger is being funky and wouldn't allow me to post. It's a conspiracy, a conspiracy I tell you! Anyway, what caught my attention in this NY Times article were the references to Marin County; so I'm sharing it on this blog.

Some choice quotes:
Many Americans who planned on real estate as their path to wealth are beginning to find that there are limits to how high is up.

Blame market forces. As higher interest rates dampen demand in cities and suburbs that only a year ago were battlegrounds for fierce bidding wars among numerous buyers, sellers are grudgingly lowering their prices to drum up interest.

A house at 57 Marina Boulevard in San Rafael, across the bay from San Francisco, was originally listed at $1.45 million. The owner recently dropped the price to $949,000 when a competing house on the same street lowered its price to $959,000, from $989,000. In Marin County, the prices of about a quarter of all listings have been reduced [true enough, see here; as of yesterday it's up to 27%]. County records show that 57 Marina Boulevard was sold in February for $700,000, so the owner, Dan Marr, is unlikely to lose money even at the lower price, though he may not make as much as he had hoped. "I don't want to talk about it," he said.

It is getting tough out there for sellers. What is happening in Marin County is being repeated in cities and suburbs across the United States. Nearly a year after the sales of homes peaked, buyers are wresting control from sellers in many areas as inventories of unsold homes have grown, in some markets doubling.

It is a slow leak, to be sure. The most widely used statistic to measure home values, the median home price, shows that once-hot markets like San Mateo, Calif., and Mercer County, N.J., are now registering year-over-year declines.

Robin L. McCarthy, a real estate agent who works in Princeton, N.J., said homes were sitting on the market three to four months, when houses sold in as little as a few days a year ago. Houses that would have been the subject of intense bidding wars now sell for slightly less than asking price.

"It's going from a seller's market to a buyer's market," said David Lereah, the chief economist for the National Association of Realtors.
What is rather startling to me is how quickly RE is trending down despite the fact that mortgage rates aren't up all that much (on a historical basis) and the economy is supposedly strong. Some readers of this blog have commented on how great the Bay Area job market is supposed to be. Yet already we hear about price cuts for a large percentage of the houses on the market, inventory is high, price appreciation ranges from weak to flat, and foreclosures are way up. Just imagine what would happen if we were to slip into an actual recession!

The usual caveat: The spring selling season is still young; anything could happen. We'll see...

Sunday, May 07, 2006

Price Reduced in Marin

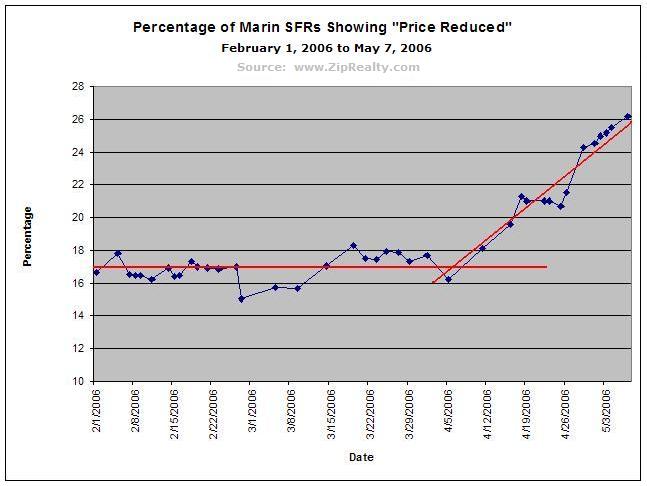
Ever since ZipRealty began keeping track of properties listed as "Price reduced" I've been recording this data for Marin almost daily. I search for all Marin SFRs falling within the asking price range of $10,000 to $10,000,000.

In the graph below you can see the data that I've collected so far. From February to April, 2006 the percentage of SFRs sporting "Price Reduced" hovered around 17% and then took off. We just broke through the 26% mark -- that is, 26% of all houses currently listed in Marin are listed as being "Price Reduced".

How high will it go? If 'everyone wants to live here', and if 'Marin residents are financially savvy', then why are sellers in Marin being forced to reduce their asking prices?

It seems to me that anyone thinking of buying a house in Marin now would be far better off just waiting. The lower the selling price, the lower the property tax you have to pay year after year after year after year...
“But to every thing there is a time and a season, and that’s as true for home buying as it is for everything else,” Fletcher says. “The people who win big in the real estate game are the ones with the courage to sit out the manias as the markets reach their peaks and buy during the busts.”

-- June Fletcher, "House Poor: Pumped-Up Prices, Rising Rates, and Mortgages on Steroids"
It seems to me that price is a matter of opinion; debt is real. In this buyer's market, show no pity as sellers have shown none in the recent past.

Thursday, May 04, 2006

Myth Busters

Fortune magazine has a series of interesting articles. The first is their RE bubble burst survival guide. Notable quote:
There’s no mystery about what it will take to close the affordability gap and bring the markets back to life: Prices will have to come down, and incomes will have to move up. The only question is how much of the adjustment will come from rising incomes and how much from falling prices.
Gee, I wonder which one will adjust first: incomes or house prices?

But the best one in the series IMO is their unmaking of RE myths article. Here are the myths that they debunk (just read the article to understand why they say these myths are bunk):
The sudden shift in the nation's housing markets is exploding some long-held beliefs. The first is that a scarcity of buildable land on the coasts keeps a cap on supply and prevents prices from falling.

A second myth is that today's big homebuilders learned their lesson in past downturns and now launch projects only when they have firm buyers lined up.

A third tenet holds that home values never drop in areas where employment is rising.

The current boom has spawned one new myth of its own: Hot markets will glide to a soft landing...But the housing bulls are relying on wishful thinking.

The New Road to Serfdom

Does anyone have a subscription to the article by Michael Hudson and who is willing to quote snippets from it? Anyway, I did find an old interview with Hudson here which is rather depressing.

Wednesday, May 03, 2006

Housing Bubble Contest

I am running a housing bubble contest. The first prize is a copy of this ebook kindly provided to this blogger by its author (here is a "review" of some of the arguments made in the ebook). There are no second or third prizes; it's winner takes all.

The task: Make an argument for why "it is different this time; there is no housing bubble".

The rules:
  1. Only people who still truly believe that there is no housing bubble can participate.
  2. You must have an open mind and promise to read the ebook.
  3. Your answers must be submitted to me by email and your email must contain in the subject line only the word "ebook". Submissions left in the comments section will be ignored.
  4. The judges will be myself and RESkeptic if he wants. The winner will be the person who best explains why it is different this time and there is no housing bubble.
  5. The winning answer may be published on this blog (anonymously or not at the winner's discretion).

Monday, May 01, 2006

Marin's Golden Houses

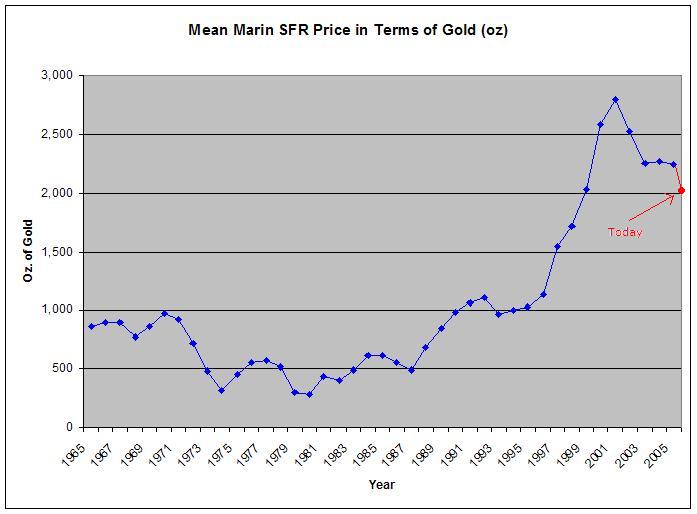
Some people argue that the US Dollar is a "fiat currency" and not real money (the list of groups who debate this issue is endless, but you can find some good discussions here, here, and here). To these folks "real money" is gold. I don't want to get into that debate now but I did want to know how much a house in Marin would cost if money was denominated in ounces of gold and not created out of thin air.

So here's the answer. In order to make the following graph I took the mean price of a SFR in Marin and divided it by the average price of an ounce of gold for that year (so sales prices are automatically adjusted for inflation as well as the amount of fiat currency in circulation [which some would say is exactly the same thing as inflation]). The result is how many ounces of gold you would have to fork over to buy a house in Marin for the 40 years spanning 1965 to 2005 (in blue); the data for May 1, 2006 is in red.


There are at least a few interesting features of the plotted data:
  1. First, notice the way house prices (in terms of ounces of gold) jumped in the mid-90's to its maximum in 2001. After the terrorist attacks in NYC the price of a house in Marin actually fell and fell hard (-20% as of 2005 and -28% as of today).
  2. Furthermore, this graph is yet another demonstration of how Marin house prices and values do in fact fall in real terms; I count seven drops in value in all, five of which were significant.
  3. Last and certainly not the least, the price of a Marin house, in terms of ounces of gold, was essentially flat from 2003 to 2005, inclusive. Yet, as we all know, house prices (in "fiat dollars") in Marin went ballistic during that time. I think that clearly demonstrates the effects of easy credit and the rampant printing of dollars during those years.
Here is what the average price of a house, in terms of gold, has looked like in the UK (from April, 2004 to April, 2006); like Marin, it's down:

It might prove interesting if others repeated this analysis for their real estate markets so that we could compare and contrast.

Enjoy.

Confidence in Housing Market Dips

A new Gallup poll indicates that popular confidence in housing is falling precipitously:
The volume of U.S. home sales is near the record high seen in 2005, but Americans are much less confident today than they were a year ago about the advisability of buying real estate. Just 52% of Americans say now is a good time to buy a house, down from 71% last April and 81% in 2003. Residents of the East and West are especially likely to consider it a bad time to purchase a new home.

Housing looked like a good deal in the recent past when single-family homes were experiencing back-to-back years of double-digit appreciation and, in many markets, savvy investors could flip a home in a matter of months for a hefty profit. Now that the increases appear to be slowing, and home values are leveling off at fairly high prices, prospective buyers are naturally more concerned about paying top dollar.

The recent decline in consumer optimism about the housing market is seen with all major income groups and regions of the country.
As a commentor over at the Bubble Meter blog mentioned, that first graph in the article is misleading because the last few data points are very close together in time as compared to the other data points. It misleadingly gives the impression that the decline in confidence of late has been gradual. Here is the same data but graphed appropriately: