California's high cost of housing has given the state one of the worst poverty rates in the nation, according to an independent study that was welcomed by critics who believe the government's method of counting the poor overlooks many people.
Thousands of Silicon Valley residents, for example, are living in poverty even though they earn more than the official federal standard, according to researchers at the non-profit Public Policy Institute of California, who calculated the numbers after adjusting for local housing costs.
The study confirms what social workers and the working poor have known for years:
``If you're poor here, you're really poor,'' said Candy Capograssi, deputy executive director of the Santa Clara County Housing Authority, which recently had more than 70,000 people submit applications for a housing subsidy waiting list.
Using the official federal standard, California has the 15th-highest poverty rate in the country, with 13.3 percent of its residents living below the poverty threshold.
But when Reed adjusted the formula to reflect the cost of housing, California's poverty rate rose to 16.1 percent. That gave it the third-highest ranking in the country, Reed said -- behind only Washington, D.C., and New York.
Thursday, May 11, 2006
Really House-Poor
California, look at what your "progressive" NIMBYism has wrought:

Anti-affordability
Check out this post over at the Sonoma Housing Bubble blog. Athena's comments are spot-on IMO.
Bay Areans Scared of the Housing Bubble?
The most excellent Seattle Bubble blog was apparently playing around with Google's new Google Trends functionality. That blogger searched on "housing bubble" and the top 10 cities searching on that search phrase came up like so:
Apparently people in the greater San Francisco area are more worried about a housing bubble than anyone else in the country—by a pretty wide margin—and Californians in general are the by far the most worried about their precious bubble being burst.
- Santa Clara, CA
- Pleasanton, CA
- San Jose, CA
- Rancho Santa Margarita, CA
- San Diego, CA
- San Francisco, CA
- Irvine, CA
- Reston, VA
- Washington, DC
- Sacramento, CA
Wednesday, May 10, 2006
House Prices in Marin Dip in April
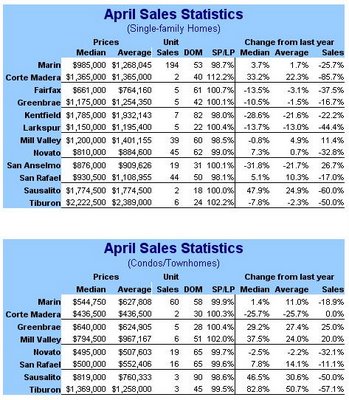
Vision RE has this to say about the April sales results for Marin County:
This is just more evidence that the so-called "spring rally" in Marin is more like a "spring flop".
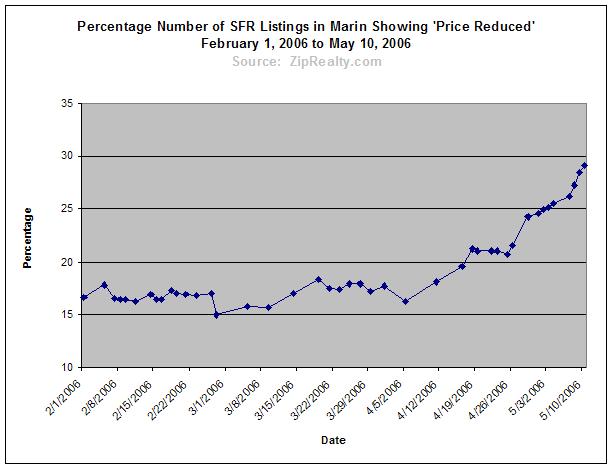
And don't get your hopes up for May either as the Marin Heat Index is not suggesting that May will be any better. But sellers are trying to do the right thing, bless their little (greedy) hearts -- as of today 29.1% of all listings are marked as "price reduced" according to ZipRealty but those reductions are a joke; it's going to take more than a measely 5-10% price reduction.
I'll do the usual charts in a later post. But looking at the above data tables I think these reported SFR statistics may be meaningless. I mean, just look at some of the sample sizes... in 7 out of 11 Marin markets the number of units sold was less than 10, some as low as 2. Sheesh. I mean, if you exclude the two towns that look most aberrant (with only 2 sales each) -- Corte Madera and Sausalito -- then the median year-over-year sales price is down -10.5% and the average sales price is down -5.25% year-over-year in that table.
But if these results can be believed, then it makes me wonder: Is this the best that it is going to be? I mean, this is supposed to be the hot, hot, hot selling season and everyone wants to live here, right? What happens as increasing interest rates work their way further into the system? Tighter lending standards? Even the Marin IJ has turned a bit negative and is bemoaning Marin's shameful unaffordability.
Anyway, I'll put the graphs together later but frankly I don't see much point in it; this thing is coming apart.
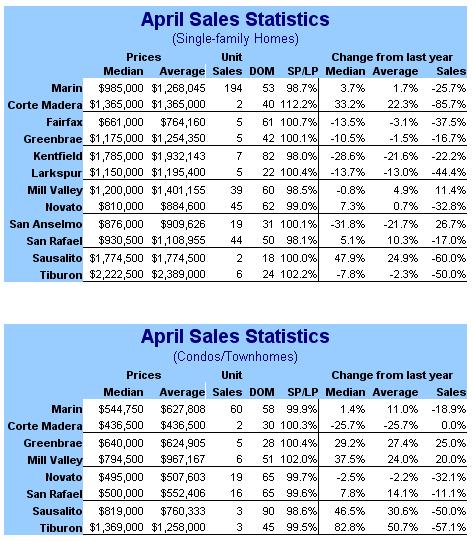
Home Prices Dip in AprilPercent sales for SFR for all of Marin were down -25.7% year-over-year -- ouch!
The median price for single-family homes in Marin County fell 1.5% in April to $985,000. Year-over-year, the median price was up 3.7%. The average price fell 4.6% to $1,268,045, up 1.7% over last April.
This is just more evidence that the so-called "spring rally" in Marin is more like a "spring flop".
And don't get your hopes up for May either as the Marin Heat Index is not suggesting that May will be any better. But sellers are trying to do the right thing, bless their little (greedy) hearts -- as of today 29.1% of all listings are marked as "price reduced" according to ZipRealty but those reductions are a joke; it's going to take more than a measely 5-10% price reduction.
I'll do the usual charts in a later post. But looking at the above data tables I think these reported SFR statistics may be meaningless. I mean, just look at some of the sample sizes... in 7 out of 11 Marin markets the number of units sold was less than 10, some as low as 2. Sheesh. I mean, if you exclude the two towns that look most aberrant (with only 2 sales each) -- Corte Madera and Sausalito -- then the median year-over-year sales price is down -10.5% and the average sales price is down -5.25% year-over-year in that table.
But if these results can be believed, then it makes me wonder: Is this the best that it is going to be? I mean, this is supposed to be the hot, hot, hot selling season and everyone wants to live here, right? What happens as increasing interest rates work their way further into the system? Tighter lending standards? Even the Marin IJ has turned a bit negative and is bemoaning Marin's shameful unaffordability.
Anyway, I'll put the graphs together later but frankly I don't see much point in it; this thing is coming apart.
Tuesday, May 09, 2006
Earthquake Risk
RESkeptic asked me to post the following on his behalf (Blogger is, as usual, making doing it himself difficult); it can be considered a companion post to this one:
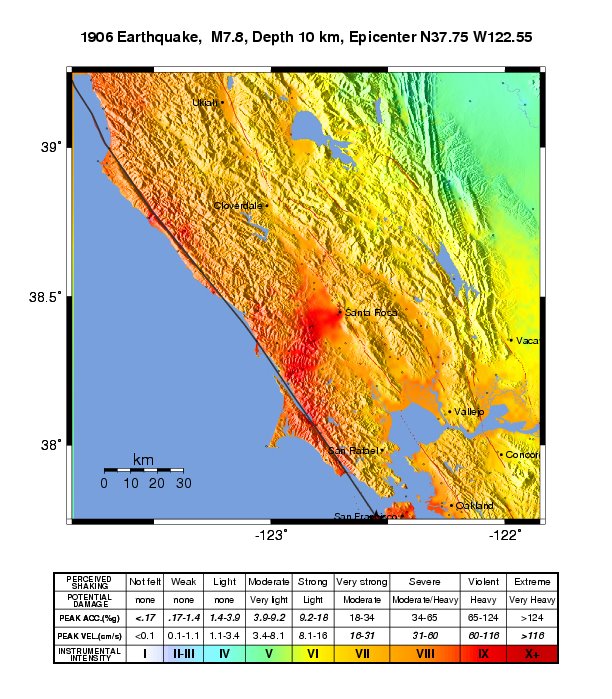
Here's a very interesting map I found on USGS. I think this serves well to "burst the bubble" about the assumption that damage from big quakes are localized to a specific area. What I've written below could serve as the writeup for a new article.
When we look back to the earthquake of 1906, we tend to think of the damage and loss of life in San Francisco. However, a quake of similar magnitude (7.8) could produce far more damage today than we may realize. Consider this USGS map, which estimates shaking intensity and damage to Marin and Sonoma counties. To my surprise, areas of Sonoma county such as Santa Rosa, Sebastopol, and Bodega Bay could be heavily damaged by another San Andreas quake centered near SF. Given what could happen to these areas, are all residential and commercial structures adequately prepared for a big earthquake? That would be something to look into if you're considering buying a home in these areas.
While Marin and Sonoma counties have historically fewer quakes than the corridor from San Jose to Monterey, it's important to note how Marin's local geology could magnify earthquake damage. As documented earlier, liquefaction poses a risk in some areas. Additionally, local geology and wet weather could heighten the risk to homes in our coastal hills. If you've driven highway 1 recently into Stinson Beach, you cannot miss the sliding caused by bedrock instability helped along by strong winter rains. While we normally consider bedrock to be stable, hillsides containing serpentine can be an exception to this rule. Since serpentine is a very slick fault line rock, hillsides containing both serpentine and ground water can give way--especially in an earthquake. This is a hidden risk present around Mt. Tam, the headlands and Tiburon. I've even seen new homes in "level" tracts containing serpentine that sustained continued, expensive damage due to settling. Given the complex geology and possible hazards in Marin, I think that anyone shopping for a home should be aware of their risks, even hiring a specialist to assess these risks before purchasing. If the 1989 Loma Prieta earthquake is any indication, it can be very expensive and sometimes impossible to fix your home after an earthquake.
Here is the source page for this map, along with several others for the 1906 earthquake.

Latest Blog Listings
I just noticed this site in the list of "referring URLs" to this blog. It is a listing of the latest posts on the various bubble blogs. I don't know how complete it is or how they compile it, but I think it should be useful to some folks.
Subscribe to:
Posts (Atom)