 I decided to strip out everything except the US data so that I could see the US data more clearly:
 And then I realized that I have similar data for Marin and wondered if I had shown it before on this blog or not. I don't think I did. So here it is.
Below is a graph of the yearly price of a Marin house (mean Marin SFR sale price divided by 30) divided by the mean yearly rent in Marin county for each year from 1995 to 2005:
 The ratio of yearly sale price to yearly rent is roughly constant up to about 2002-2003 and then goes through the roof. IMO this graph nicely illustrates the bubble in Marin.
FYI: Taking the mean sale price and dividing it by 30 (years) vs. some other number would not change the shape of this graph and seems a whole lot safer than making assumptions about typical lending rates for each year, what sorts of mortgages people favored, etc.
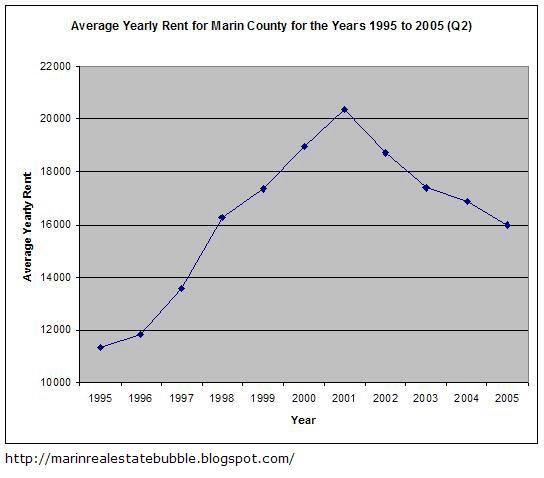
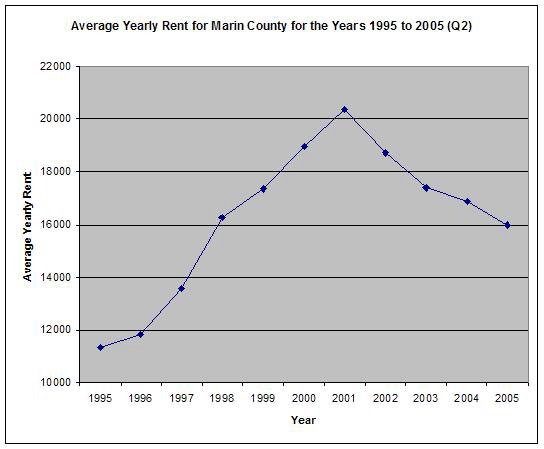
Update 10-08-06: To understand that last graph, above, you need to understand that rents have not been getting consistently more expensive with time (but they are probably rising again now):
8 comments:
Wha Happened?
Why did it go up so steep?
Who can afford this?
I think I'll rent a while.
Not sure I believe these numbers. According to your graph, the current ratio is about 2.8. Therefore, ratio of home cost to monthly rent is 2.8 x 360 mos. = 1,008. This would imply that you can rent a $1 million home for $992 per month. Not in Sausalito, or any other part of Marin that I know of. Did I miss something?
--Joel
Even at the 1.5+- ratio shown for 2002-2003, this would imply a monthly rent of $1,851 for a "$1 million" home. I'm a renter and I can't get anywhere near this much bang for my rent buck, even in today's market.
--Joel
Joel --
The ratios are probably too high because no attempt was made to equate rent/sq ft with sales price/sq ft. The graph just shows how the two (rents vs. sales price) change with time, one relative to the other. So the plotted trend line is correct but just needs to be shifted up or down a little as a whole (probably down).
IOW, if you wanted to use this plot to predict how much you would pay in rent for a house of a given price, then you would have to apply a scaling factor of unknown amount and that changes with time (see plot below).
When I was given the rent data (after begging a local agency for it; the sales price data comes from the Marin Assessor's Office by the way) it did not occur to me at that time (last year) to have it broken down by sq ft of rented space as I am only interested in trends.
You also need to understand that rents got cheaper relative to sales price...they were not getting consistently more expensive with time (but I believe they are rising now) like sales prices were. I posted that plot a long time ago. You can find it here:
http://tinyurl.com/egnph
I will alter the original posting with the above mentioned graph since it should satisfy the skeptics.
Thanks for that question.
Questions? Satisfied?
Hey Marinite!
You are right about the better deal of renting.
I don't know what your charts are but it better by far now to rent.
I got enouff to buy 2 houese and I keep my dollar for a better deal.
FYI, the Marin Heat Index™ is at 0.42 as of today. Go Marin!
"Update 10-08-06: To understand that last graph, above, you need to understand that rents have not been getting consistently more expensive with time (but they are probably rising again now):"
********
From my completely unscientific sampling, rents do seem to be rising in SF and in Marin. With a noticeable jump in the last six months in the City.
But in many cases they have to go up a good amount yet to reach what they were in 2000.
And, of course, rents should be rising right now - because it appears it is a very rare person that is a first time buyer candidate, who is also thinking about buying any time soon...
They are all waiting for the insanity to end. I say good for them!
It's an understatement to say it has a ways to go yet.
Marinite--Thanks for the explanation. I agree with the trend depicted in the graph. Leaving aside foregone appreciation of the past several years, renting has been a better deal for some time now.
--Joel
Post a Comment