Assuming it's accurate, I'm not sure what the correct interpretation of this graph should be. That is, housing in more inland markets is going full tilt gonzo. So you'd think this graph would show an increasing trend. Right? But it's not; it's down. That means that the gains in the more inland frenzied housing markets are being off-set by other markets, presumably those formally hot markets on the coasts. Well, one can hope.
Some choice quotes:
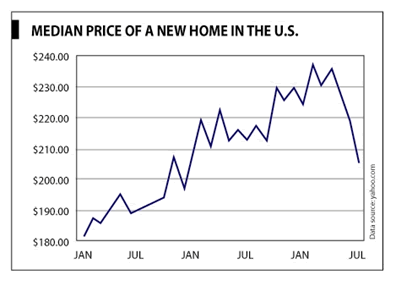
"The median price of a home fell in July by a whopping 7.2%."
"And the details paint an even more alarming picture of the staggering decline in the U.S. housing market. Since April, median home prices have fallen 14% ... They fell from $236,300 in April to $203,800."
"Now is not the time to speculate in real estate. Simply put, your downside risk is greater than your upside potential right now."
No comments:
Post a Comment