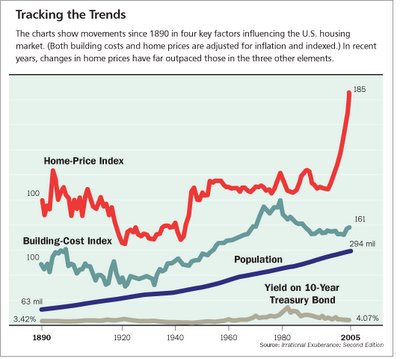
Here is Figure 2.1 from Robert Shiller's book
Irrational Exuberance showing long-term housing valuations from 1890-2004. I would have used a scanned version from my copy of the book but didn't for fear of copy right violations. Fortunately, this image was posted on the Housing Bubble 2 blog and so I am showing that here.


2 comments:
Finally got around to posting a link to your site; long overdue. Schiller is a great resource, but predicting when the madness is going to end is of course really difficult. This so feels like it is the downside of the top for the past 3 months, but we'll see in the spring.
Keep up the great work!
Yet another gravity defying figure showing the "mirage" of home prices compared to almost anything else (incomes, rents, population....))
Oh, the insanity of it all.
Post a Comment