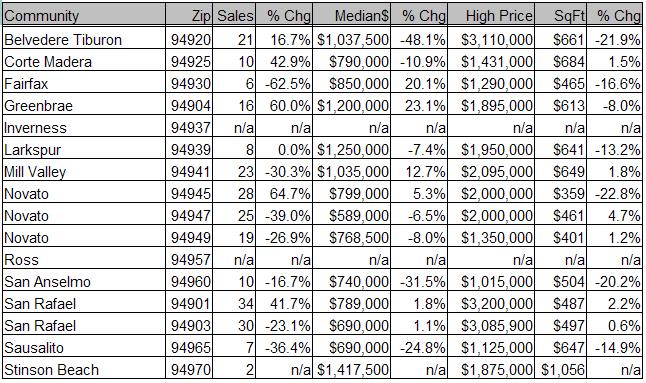
 What I find interesting about the above chart is that they are showing the percent change in the price per square foot. Many rows where there is a positive percent change in the median sale price has a corresponding negative percent change in the price per square foot slot.
Is this indicative of how prices can drop while at the same time the median price in the county goes up a little or stays basically flat -- people are buying more house or a better house for the same amount of money?
2 comments:
I've never understood the relevance of the price per square foot, especially after looking at a property tax bill. In Marin it seems to break down as follows:
Land = 65% or more of total value of property
Structure = a mere afterthought
It just seems like a poor metric that doesn't really create the basis for an apples to apples comparison. Something the RE biz seems to throw out there all too often.
"Structure = a mere afterthought"
That's certainly true of all those listed homes with dry rot and other signs of gross, long-term negligence. Driving around Marin, I sometimes wonder if I live in an Appalachian coal town.
Post a Comment