* * *
I've been waiting for Vision RE to post their results for December and so that's why I've been holding off on this post. Well, still nothing. I'll update this post as soon as their data comes in.* * *
Here is my summary of the results for December, 2006 for Marin:DataQuick's compilation of everything that sold in December shows that Marin prices were up a whole 3.1% whereas sales dropped -13.4% compared to December, 2005:
 Here is the same data as above except plotted and compared to past months' data:
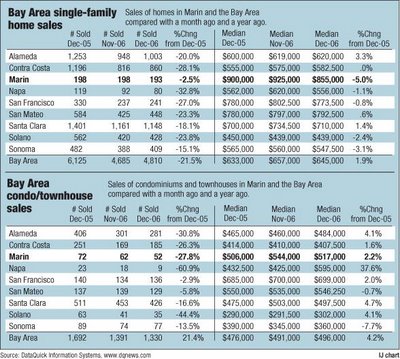
 The Marin IJ pays for DataQuick's data and so they get to see how specific categories of properties are performing. According to the ever-bullish IJ, Marin's SFRs lost 5% of their value compared to what they were worth a year ago even though the actual number of sales in December, 2006 was essentially unchanged from December, 2005:
 From the IJ article (emphasis mine):
The median price of a single-family home in Marin slipped to $855,000 in December, down 5 percent from the previous year and about 8 percent from November...I thought that couldn't happen in Marin. Anyway...
The December decline was the steepest in the nine-county Bay Area, where prices remained lodged in a generally flat pattern...
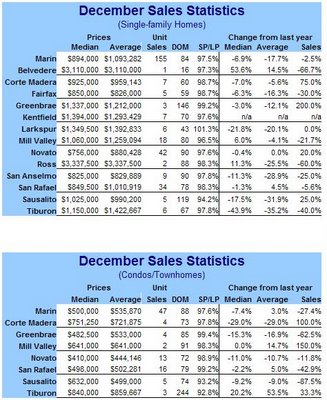
Here are Vision RE's results for December, 2006 -- median price for Marin down -6.9% and the average price down -17.7% (both year-over-year) yet sales activity was barely different from December, 2005. But before you wet your pants, keep in mind that theirs is a sampling of Marin:
Home sales in Marin County last year declined for the second year in a row: dropping 16.6% from 2005. Home sales were at their lowest level since 2001. Condo sales also fell for the second year in a row: down 23.6%.
The median price for single-family homes declined for the first time since before we've been keeping track: 1995...
...Marin County home sales were down, year-over-year, every month in 2006: usually by double-digits. The good news is the year-over-year losses turned into single-digits for the last two months of the year.
The median price for condos ended the year at $500,000, the low for the year. Condo sales were up 4.4% in December from November, down 13% year-over-year.
 Below is a chart showing the percentage of SFRs currently on the market that are advertising "price reduced". (To those of you who are new to this and similar charts: the way I have been collecting this data is to do a search over all of Marin for any type of detached SFR whose asking price falls within the range of $100K and $10 mill.)
As the following graph shows, the percentage of houses advertising "price reduced" has dropped in line with the steep decline in the number of houses listed during this slow time of the year. Interestingly, the percentage showing "price reduced" appears likely to be significantly higher than it was in December, 2005.
 Below is a chart showing Marin foreclosure activity according to RealtyTrac. I don't have much to say about this data yet as I still do not have much of a feel for how this sort of data changes with time. However, I think the increase in the number of properties in auction and the number reverting to bank ownership is disturbing.
 Liz McCarthy (a Marin real estate agent) had this to say about December's results:
Although there are considerably less homes [sic] on the market this month as compared to last month, there are still more than the previous December (898 compared to 622 in December 2005), the percentage of homes in contract went up slightly (very slightly). My feeling is that many of the homes that did not sell have been pulled from the market, anticipating the slower months during the holiday season, or to possibly restart the Days on Market [DOM] clock for that house trying to regenerate interest.So according to Ms. McCarthy the inventory of houses on the market in December, 2006 was 44% higher than it was in December, 2005 while at the same time the percentage of houses that actually went in contract was essentially unchanged.
Finally, I'll close with a recent quote from economist Christopher Thornberg in the SF Chronicle about December, 2006's Bay Area real estate results:
While many in the real estate industry say that the downturn in the housing market is over, economist Christopher Thornberg disagrees. ‘I’m hearing all this nonsense about a soft landing and rebounding in 2007, and that’s just incorrect,’ he said. ‘It just doesn’t work that way — housing cycles when they pop take years to clear out of the system, not months.’
10 comments:
When the SF Chronicle and the IJ published the December results, neither newspaper touched the subject of inventory. So, December inventory was a whopping 44% higher than last year. Can you imagine what will happen new inventory and re-lists hit the market soon?
I think if we have another couple of months of negative YOY stats, the tide will surely have to turn. There's no way people can look at that and say it's a bubble everywhere else but here, everyone wants to live here, we're special, blah, blah.
It looks like the spit is starting to hit the fan.
Logic may take over.
If the fundamentals are storm clouds on the horizon,
I think I'm feeling the first sprinkles.
where can I get the inventory numbers for marin?
Can someone explain to me how the total yoy price went up 3.3% when SFH went down 5% and condos only went up 2%? What else gets included the total?
What else gets included the total?
Very good question and I wish I knew the answer. Part of the answer consists of house boats, raw land, new development (of which there is very little of course). But as for the rest, we may never know given how tight the re industry is with its data. There is so much manipulation. I try to put it much of it on one blog page so at least it is all in one place.
Can someone explain to me how the total yoy price went up 3.3%
Sure. That's the number that is fed to the public. So it has to look as good as they feel they can get a way with.
I need to set up a donation so that I can collect the money I need to afford a DataQuick subscription so that I could then get the break downs. Sigh.
While I'm on the "crash crash crash!" bandwagon all the way, and even though some markets are starting to show a slight downturn, itt is still depressing to see that in reality, most BA cities are showing almost deadlined, flat appreciation. In most cases, actual normalized appreciation of 1-2%.
That almost supports the " we're leveling off" NAR proposed prediction. I certainly hope not.
I HOPE that once spring rolls around, the roller coaster really gets going and those prices start to hemorage.
Remember all the prices points thrown around are median, and don't have much to do with an individual home's appreciation or lack thereof. In a slowing market, if the upper end starts to make up a larger % of sales, then the median will rise, even if prices for individual homes are flat or declining.
The key is inventory.
Doug Kunst's blog had some interesting figures on statewide REO's.8-06,32 REO's per day,statewide.12-06,300 per day.the first wave of resets started in june 06...so this should be an indication of what lies ahead.as far as marin,"prices may be down,slightly, but VALUES ARE UP! because new buyers can afford upgrades that they could not before!!! I think a statue of Kwan Yin in the garden would be just right,any other suggestions?
That foreclosure graph is interesting and mirrors what I saw today when I checked a Seattle zip on www.foreclosure.com.
There were 295 properties in various states of foreclosure/preforeclosure. Fall '05 when I checked that same zip there were about 40.
Also, Zip Realty shows only 43 properties "for sale" in that zip code.
Is the "foreclosure properties" inventory vastly bigger than the MLS?
There may be a LOT more available properties out there than we realize.
Post a Comment