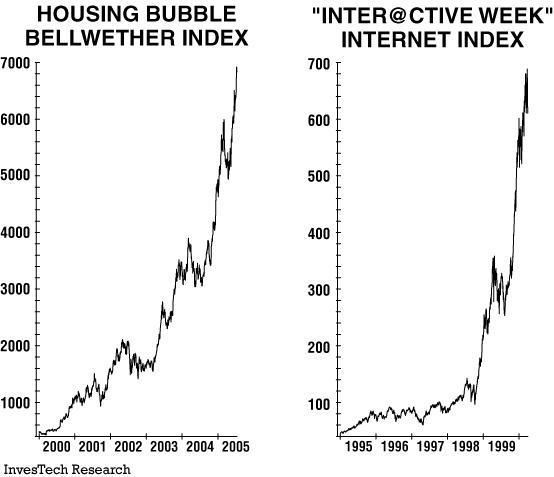
Jim Stack provides this remarkable chart of how similar the two back to back mania's have been. If you look at these two charts, one is the housing mania from 2000 - 2005 (represented by housing stocks) and the other is the internet tech bubble from 1995 - 2000.
They both lasted for 5 years and had parabolic blowoffs of 1323% and 1395% respectfully. Manias most always retrace to below the starting point of the mania. The Interactive week internet stock index is currently around 150! (not shown)
Kirby
Tuesday, July 26, 2005
Tech Bubble and Housing Bubble Side-By-Side
This is from a posting in The Daily Reckoning forum:
Subscribe to:
Post Comments (Atom)
1 comment:
Are there other forums/blogs that are more specific for this topic? I have not found one.
Post a Comment