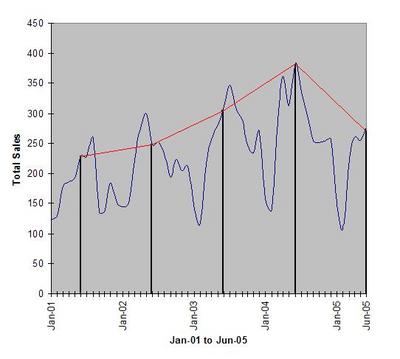
The following chart shows total sales in Marin from January, 2001 to June, 2005. The black, vertical lines mark June's data for each year. The red lines connect the points where the black line intersects the total sales data (blue line). Notice that for the first time in five years the line trends downward by a significant amount.

3 comments:
Thanks for the information. By providing this information, you are performing a valuable public service.
I've been monitoring the
Marin real estate market the past several months because I'll need to buy a home relatively soon. My sense is that there has been a large and sudden reduction in the rate of price appreciation during the last month or so. In fact, it seems like some newly listed homes are being priced at less than they would have been only a couple of months ago. An example is 28 Dorothy in Novato at $998K, 5 bedrm., 4 bath, 3200 sq. ft, built in 2001. My guess is that this house would have been priced at around $1.050 - 1.1 million a month or two ago. I've also noticed that the new homes in the Breakers development in Novato have not been selling as briskly as they once were, although this probably has more to do with the poor location of the available lots (i.e., the lots fronting Ignacio Blvd.).
nice job. thanks for the useful graph.
9:55,
Price reductions started in earnest last year but only for the above roughly $1 mill houses. Then, sales were hot for anything below about $900K. Now it seems sales are only hot for things below $600K or so (refer to a previous post (about North Bay Area realtors reluctantly admitting to slowing) probably in the July archive now).
Post a Comment