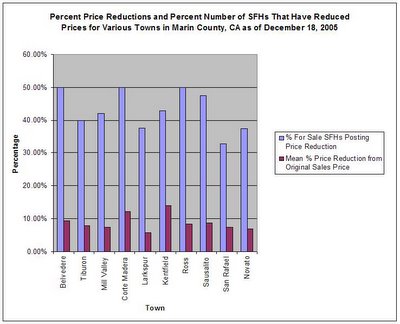
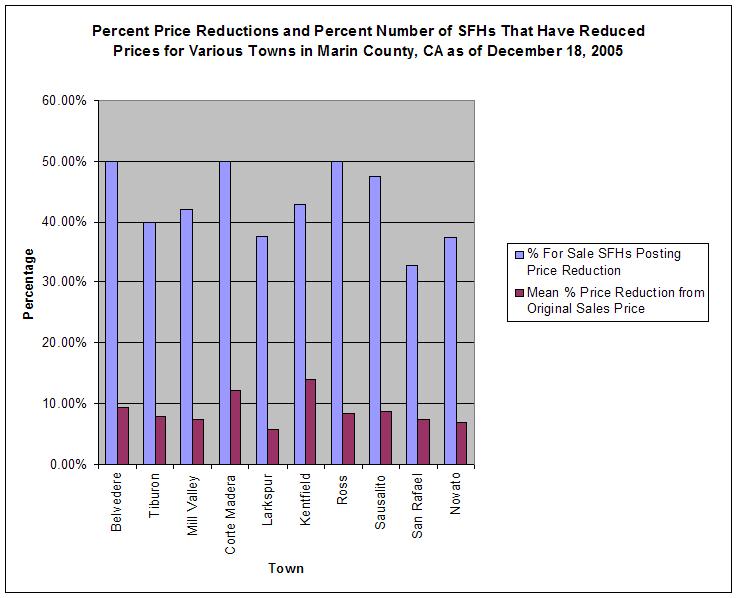
In the following graph I show, for selected towns in Marin County, the percentage of SFHs that are for sale and that have posted price reductions and the mean percentage price reduction as of today, December 18, 2005. This is not an exhaustive analysis but I was as complete and as accurate as possible. This analysis also does not include houses that are under construction and only shows the most recent reduction from the price that the MLS claims is the "original" asking price*. Also keep in mind that this is traditionally a slow time in the market; in the Spring I will again perform this laborious exercise so that we can compare it to the end of this year.
(Click on the image for a larger view.)
Sample sizes:
Belvedere - 18
Tiburon - 35
Mill Valley - 50
Corte Madera - 8
Larkspur - 8
Kentfield - 14
Ross - 10
Sausalito - 19
San Rafael - 55
Novato - 99
*I cannot know what "original" asking price means. Does it mean the first asking price when this property first went on the market? Is it the last asking price before the current asking price?
 (Click on the image for a larger view.)
17 comments:
Another great chart from you, Marinite.
The spring one will be nice to see.
Great research Marinite!
Btw, sometimes I find the original asking price by Googling the address. Nice thing about Google: they often cache the old realtor listings (or the realtor forgets to update).
It is amazing. A roughly 40% of houese are reducing their prices. Can we say the bubble is leaking?
Thank you Marinite for the hard work.
reskeptic -
Yes, you are quite right. But Googling takes time and I am still never sure the price I see is the true original price or if it's some other price with some different owners (given how fast some properties flip). If I was paid to do this then I would but as it is it's all spare time.
I would assume this chart shows the optimal picture of houses price reduction since Marinite could only include the most recent price reduction. If the second, third, or multiple price reductions are included, those purple bars would be much higher.
If the second, third, or multiple price reductions are included, those purple bars would be much higher.
You are quite correct. I was deliberately conservative. What you see in the graph is the most optimistic picture. The true picture is much worse for the reasons that you describe.
If I was paid to do this then I would but as it is it's all spare time.
Well, judging by your sample size, nobody can argue this represents a significant time investment--and a correspondingly informative analysis.
And, since I possibly have more time to kill, I wouldn't mind digging deeper on some of those properties to compare the "top" to current pricing.
By all means, go for it.
I wouldn't mind digging deeper on some of those properties to compare the "top" to current pricing. - reskpetic
Thank you reskpetic for taking up this task. The more realistic the data is, the more we could gauge the price deduction trend. Purple bars represent how much air comes out from the bubble.
Just a note from Sonoma Co, the price reductions come thick and fast...one friend who has had his house on the market with no takers, and a lovely house it is too, has reduced the price in increments over the last several months. Now he's down about 50k from his original price and is about to pour 25k into a kitchen upgrade..I supose "for the spring" Hell, I'd buy his house, it's a beautiful place, but it would have to be a whole lot lower...more in line with a bit more than he paid for it originally.
Oh My God. The sky is falling.
This is as accurate and conservative information being displayed in the chart as Marinite has mentioned. There is no bias whatsoever. If anything, it is drawing a brighter picture than the reality is. Look at the sample size. This represents most of the houses for sale right now.
I was not trying to convey any particular point of view. This is just a snapshot of the houses showing price reductions and by how much they are currently being reduced. I didn't 'hand pick' houses to include in the analysis if that is what you are suggesting; I just went down the list in a MLS and included them in the order that they appeared.
I don't understand how anyone could have a problem with that.
Why did I do this analysis? Because this sort of information is not made readily available anywhere else.
Also, again, to be clear, what I did was look at those MLS entries that advertise a price reduction and by how much it was reduced.
This is being conservative. Why? Because what I could have done is for each house that advertises a price reduction is to go and do a search to find out what the true original asking price was (some houses, if they don't sell, are taken off the market and relisted later with a new, lower asking price so any price reduction they advertise is actually lower than it otherwise would be).
The only "statistics" I did was calculate a percentage and calculate an average.
Why did I say I was as complete and as accurate as possible"? Because since this data is not tabulated anywhere for me, I had to work my way down a MLS list and I freely admit that I might have missed one or two in the process.
So again, how could anyone have a problem with that?
fredtobik-
You are pretty close. As of 2000, there are 105,000 units, of which 36,000 are renter occupied, which means we have 65% owner-occupied, much higher than I thought. Interestingly, SF's owner-occupancy rate is 39%:
http://factfinder.census.gov/servlet/QTTable?_bm=y&-qr_name=DEC_2000_SF3_U_DP4&-ds_name=DEC_2000_SF3_U&-_lang=en&-_sse=on&-geo_id=05000US06041
...and there are 63,666 single family homes.
Data for medians and sales volume for the past 10 years is here:
http://www.westbayre.com/annual/index.html
Post a Comment