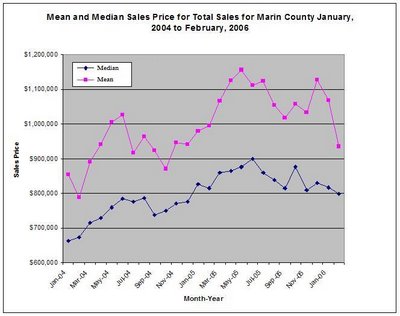
Here are the charts for total sales in Marin County (includes February, 2006 data) based on
the data from
Vision RE (was
West Bay RE...whatever). Refer to
this earlier post to read what
Vision RE had to say about the February, 2006 data. Click on an image to get a larger view.


4 comments:
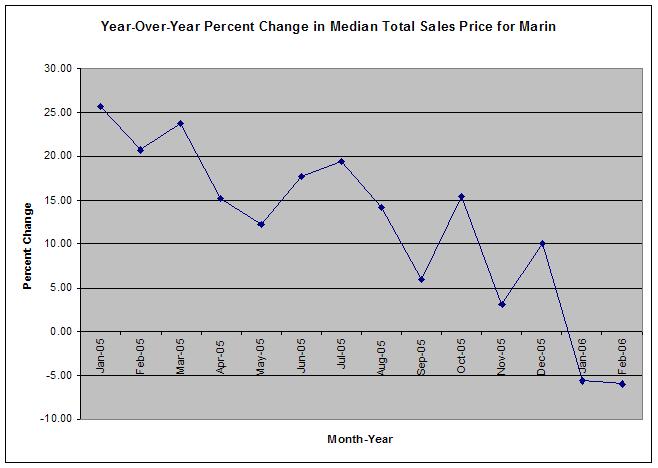
So, is that two mos of ~5% nominal YOY depreciation???
Yep, for total sales and according to their "recent sales" listing on their site.
So, is that two mos of ~5% nominal YOY depreciation???
It is odd that Vision RE's data indicates a -5% depreciation YOY (and considering their comments) when DQ News says the YOY median increased about +10%:
http://tinyurl.com/h9coq
So I don't know what to make of this just now.
I just spoke with someone at Vision RE regarding their "Recent Sales" data and why the median calculated from it differs from what Data Quick reports. Here is the response:
The recent sales by city is not the entire Marin county, but the selected cities that we track on a monthly basis.
We are confident that our numbers are coming directly from the Marin MLS sytem and of course have no idea where dataquick is getting the numbers form.
Lastly , we show 145 total sales of condos and single family homes compared to their 207 sales. We don't include anything that's not in the MLS such as new construction not sold on the MLS ( those sold through direct sales agents for the developer) and FSBO's. Also, we exclude from the MLS: farms and houseboats.
I assume that by "selected cities that we track" means that that sample of cities is supposed to provide a representative sample. Clearly, it is not very representative if DataQuick is to be believed.
Post a Comment