A place for residents of Marin County, CA and others to express their views regarding the real estate bubble and in particular the Marin real estate market
Tuesday, March 28, 2006
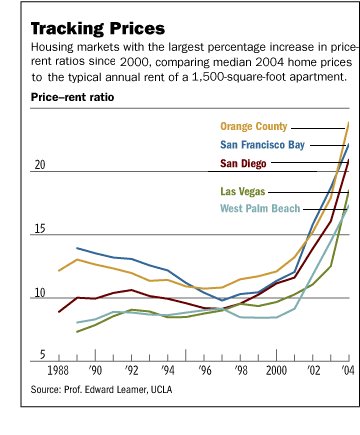
Price-to-Rent Ratios
A good series of posts on the housing bubble here and abroad can be found at this blog. Here is an interesting chart that I found there:
It's interesting that the chart is through 2004. Given the runup in prices during 2005 (at least the first 3 quarters), my guess is that things only went more "vertical" in 2005
9 comments:
I just read this today. Simple and sweet, really.
My new mantra for the bubble naysayers:
"It is dumb to buy overpriced assets with low interest rates."
Ah!
A cycle of SF Bay real estate comes to life with another informative graph!
Realtors must be cringing.
13x in 1990 (top); 10x in 1997 (bottom?).
22x in 2004; ?x in 2012
(that was '04 above! two years ago - what is it now?)
Any guesses for now?
How about for 2012 or 2013?
OK fred, I'll modify just for you.
"It is dumb to buy overpriced homes with low interest rates."
And I would further change it to "It is dumb to buy overpriced homes with ARMs with low interest rates."
"It is dumb to buy overpriced homes with ARMs and low interest rates, and even dumber to buy with a negative amortization loan"
(my contribution)
How about "It's dumb to buy what you can't afford"?
ooh... that's a good one b.durbin. LOL... what a quaint old fashioned idea. Do you think it will ever catch on?
It's interesting that the chart is through 2004. Given the runup in prices during 2005 (at least the first 3 quarters), my guess is that things only went more "vertical" in 2005
And fred -
It seems to me that homes had become assets when you bragged that your home was up 40% in "value" over the last three years?
Post a Comment