Click on any chart to enlarge it.
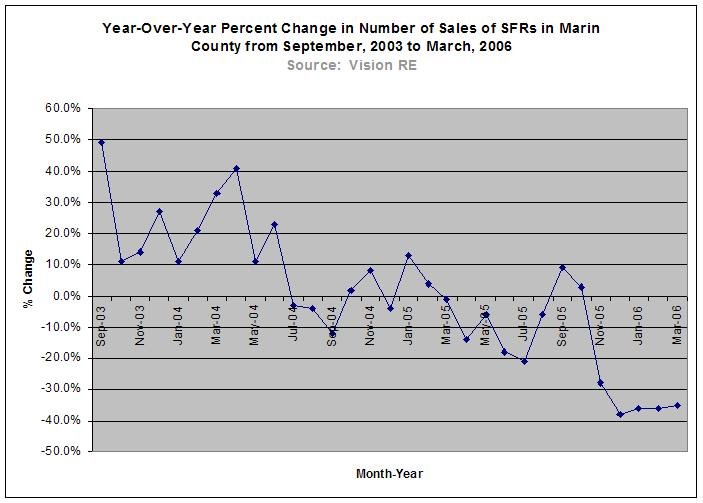
This first chart shows the year-over-year (YoY) percent change in the number of SFR sold from September, 2003 to March, 2006:
This next graph shows the YoY percent change in total inventory in Marin (unlike the other charts, the data for this chart came from here):

This next chart shows the YoY percent change in the median sales price for all sales in Marin from January, 2005 to March, 2006:
 This final chart is the weirdest. It shows the mean and median sales prices for all sales in Marin from January, 2004 to March, 2006. It's weird because the March, 2006 data point looks so aberrant. Vision RE explains the aberration as being due to an abnormally large number of multi-million dollar houses sold in March:
3 comments:
Those charts are bringing back memories.
Sometime early in 2003 (if I recall), I made the same kinds of charts. I was trying to point out to my landlord that City rents were dropping from the dotcom heydey.
We had a good relationship. I wanted to stay and she wanted to keep me in our place. So as objectively as possible, I wanted to show what was happening.
Luckily, there was a lot of rent data (by City neighborhood, # bedrooms, # of bathrooms, dishwasher, laundry, hardwood, fireplace, parking, view) on a particular renters website that showed quarterly figures for "Asking Rent."
So I plotted the quarterly data, from sometime in '99 or '00, through to sometime late in 2002 or early 2003. And while the "Asking Rent" was down as I told her, it certainly didn't go straight down.
It did exactly that kind of sawtooth pattern, dropping overall downward to the right, as we see here with your first and third charts.
Eventually, within a year or two of that, "everyone" agreed that rents were off in the City around 15 to 20% from their peaks.
Even the media finally began reporting it, until they got preoccupied with the housing mania/bubble.
Oh - and sometime in 2003 we agreed on a rent reduction of 17%.
SF Jack,
great point about those charts and rents. We had a similar situation. In 2001 we were renting a place in Sonoma, on the East side dividing our time between there and LA.
It was a great place on three acres just a few blockis from the Plaza. Originally the rent had been 2,400. a month. When things began to go down, my husband re-negotiated with our landlord who reduced the rent to 1,800. a month. I think he was just glad to have someone there. Last year we dumped our LA place and are here full time in Sonoma .From what I've seen around here people are very flexible (in the downward sense) about rents around here. I'm just waiting till they're the same way about prices.
Sales are way down below normal and inventory is way up above normal...Hmmm...what could it mean? Maybe that the Marin RE market is screwed? And that Marinites don't know it yet?
Post a Comment