It's been argued here and elsewhere ad nauseam that you can expect a 30-40% decline in house prices post-bubble.
Here it is argued that the correct expected value is a 32% drop:
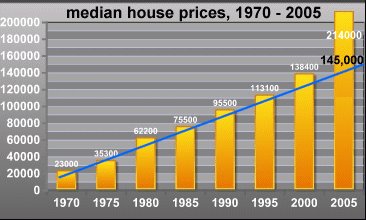
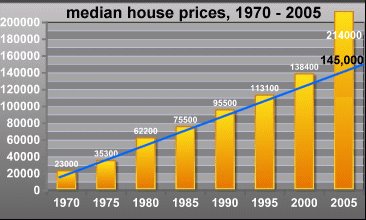
If the housing bubble follows the historic pattern of other bubbles--and there is no reason to suspect it will deflate any differently than other bubbles--we can forecast a rapid decline to the underlying trendline. And what is that trendline? If we draw a simple line from 1970 to the present through the median home price in the U.S. (not adjusted for inflation), we see that the 25-year period from 1970 to 1995 follows a very regular trendline, despite the soaring inflation of the early 1980s.
We can see that the appreciation of housing was already above the trendline in 2000, reflecting the general euphoria and asset-appreciation of the go-go late 90s. But the real violation of the trendline has occurred since 2000. The trendline suggests that the median price of a house will fall from $214,000 to about $145,000 in the next few years--a 32% decline.
There is other evidence to support this valuation target. If you consult the inflation calculator on the Bureau of Labor Statistics page, you'll find that inflation has risen from 1990 to 2006 by 52%. That is, $1 in 1990 is worth $1.52 in today's currency. (Never mind inflation has been understated for years--that's another story I've covered elsewhere.) That means the median house price of $95,500 in 1990 would equal $145,160 in today's money--remarkably close to the trendline prediction of $145,000.
Since the median price of a house in California is $535,000, we can extrapolate a 32% decline to $365,000 as a post-bubble target.
This isn't what the real estate industry wants to hear, but the charts are rather persuasive.
14 comments:
i think 32% statewide,for all properties is both a logical and rational prediction.i do not believe this market is either rational,or logical,and so predict a greater correction.some areas,and some classes of properties will have at least a 50% correction,1-4 unit properties and of course areas like merced and patterson ca.
32% is a "reversion to mean." It is impossible to revert to the mean without declining below the mean. It's a math certainty thing. Trust me on that last. The long term trend is only seen in passing; up and down. To return to the mean prices need to decline 40% and bounce. It really needs a 50% correction to "clear out" the marginal. Despite this, it isn't that bad because the graphs are not adjusted for inflation. Even using the BLS silly low numbers a 50% decline is only a 25-30% decline in real terms.
If the chart were logarithmic the 2010 value would be about $210,000
I really wish people would post true cost-of-ownership numbers as opposed to prices. Prices alone do not tell the story. The OFHEO HOI (I won't spell out this abbreviation but you all know what I am referring to and marinite refers to it frequently) is a much more useful metric than drawing a trendline through prices when they ignore both inflation and interest rates. While nominally, prices might have $95,500 in 1990, the interest rates were at 10-11% that year, which greatly influences the affordability -- I would argue in real terms (adjusted for household income, inflation and interest rates), real estate was cheaper in 2000 than in 1990.
145k for 2005 is only 5% higher than the 2000 number of $138k, which is 22% higher than the 1995 number of 113k, which is 18% higher than the 1990 number of $95k -- why would the trend indicate that 10 years of 20-ish% intervals every 6 years suddenly slows to 5%?
In fact, if you take the 30 year, Y-O-Y average gain of 6.5% (1970=23k, 2000=138k), then we should be at $189k today (6.5% compounded over 6 years) using the authors logic, not $145k.
Also this chart is not logarithmic when it should be -- even a trend line showing steady 2.5% inflation would curve up in a parabolic fashion on a chart that has an evenly spaced (20k, 40k, 60k) Y axis instead of a logarithmic one (1k 10k 100k, etc.)
Standard disclaimer: I am not arguing that we are not in an overvalued RE environment -- we certainly are by many other more reliable measures. However, it is difficult to read the tea leaves with meaningful data nevermind what appears to be bad statistical and graphing skills posing as "facts".
My own analysis on a related topic here is not only adjusted for income and interest rates, it also speaks specifically to Marin.
junkie -
Did you read my comments below your stats with regard to that info you linked?
Because if you did, you'd notice that the figures you have for Marin income for 2005 are suspect - and the time intervals you chose to explain your point were during "peak times."
As I ask in my post, what were the figures for 1995 or 1985?
And what is a true reflection of today, given higher rates than 5.86% and realizing that Marin incomes have not grown significantly since 2000?
rejunkie-
Would you please explain to me (or provide an adequate link) why a logarithmic scale is appropriate here? We are dealing with a linear set of data (prices) and not one that depends on some sort of ratio and so I do not understand the logic for a logarithmic scale.
The 10 people I know that have purchased homes in the last 2/3 years have increased their salaries far more than 10%,
You've actually asked 10 people you know what their saleries are as well as what they were in the recent past? Those must be some VERY close friends. Pardon me if I am just a bit sceptical.
...finance and investing is the #1 topic for us Gen X'ers, we don't want to end up like the Boomers.
That is potentially interesting. Would you elaborate on that?
fred -
If you think what I say is laughable, your statement is not any less so.
You talked with 10 homebuyers (buyers in the last 2 to 3 years) about their incomes, and lo and behold (surprise!) - they each report their incomes went up by more than 10%.
What a coincidence!?
[I talked to 10 Americans during the Winter Olympics and all of them told me they cheered for Americans during the Games!]
What about an equal or proportionate number of those who didn't buy homes? (perhaps excluding bubblesitters)
Did their incomes all go up 10%, too?
Maybe not. And maybe that's why they've not been homebuyers! Especially in Marin - the wealthiest county per capita in the United States.
fred and junkie -
The only data I could find for income growth in Marin stops in 2003 and relates to AVERAGE individual (per capita) incomes, not MEDIAN family incomes, the latter of which is what junkie used in his analysis.
In any case, here is what I found from the BEA (Bureau of Economic Analysis):
Per capita personal income, Marin County
2000: $60618
2001: $68035
2002: $64969
2003: $65642
Before you get all excited to point out that personal per capita income grew 8.3% from 2000 to 2003, there are two things I noted:
1) that income also declined 3.6% between 2001 and 2003, and
2) that these are AVERAGES (per capita), and therefore, the income gains and declines here may not be representative of the median family.
If you believe what is reported about higher income earners (as seen generally, in the US) having been able to grow their incomes at a faster rate than lower income earners (fred's anecdote notwithstanding), then it could be said the 8.3% AVERAGE income growth in personal income is a skewed figure to the upside because of all the CEO's, MD's, lawyers and "consultants" who live in Marin (ah... and not to mention realtors).
[And a further thought about this includes the possibility that lots of wealthy people/high earners in Marin could have been exercising stock options, or selling stock, as the NASDAQ continued its swan dive in 2001 - and perhaps that explains the "bump" in per capita personal income in 2001. Who knows? They'd have to be recording sizeable gains in a declining market if that were the case.]
Conversely, I think, it could also be said that precisely because Marin is dominated by high income earners, per capita income *is* an acceptable proxy in this case ("'everyone' grows income faster here!") for median family income and that the 8.3% figure for 2000 to 2003 income growth represents a number on its way to becoming 10% growth by 2005.
If so, my statement earlier is wrong.
But I have tended to doubt that because of the data I have seen for Bay Area incomes overall - they being "slow growing" since the dotcom debacle.
As I understand it, Marin has been "shielded" to a greater degree from the tech downturn than other areas - perhaps it was more so than I have surmised.
I got my per capita income for Marin from the BEA too. Just backing you.
sf_jack -
This one seems to back you too...
http://tinyurl.com/maopr
I think this paragraph doesn't explain well what I meant (statistical whizzes out there can correct me):
"Conversely, I think, it could also be said that precisely because Marin is dominated by high income earners, per capita income *is* an acceptable proxy in this case ("'everyone' grows income faster here!") for median family income and that the 8.3% figure for 2000 to 2003 income growth represents a number on its way to becoming 10% growth by 2005."
I was not clear - the paragraph as written didn't emphasize that I meant only a comparison of growth in incomes. That perhaps per capita income growth levels could be a "proxy" for median income growth for this discussion, since we lack complete data - I didn't emphasize that enough. I wasn't trying to say per capita income itself could represent median family income - that would be misleading (some of you are probably thinking *all* I've written is misleading).
Or maybe another way to think of this (or maybe not). If Marin is as homogeneous with regard to its population of high income earners as it appears or some would believe, then the distribution of incomes around the mean (average) might be close to the median income figure. Then presumably, the percentage growth in average incomes would be close to the percentage growth seen in median family incomes.
In any case, I'd still like to see junkie's analysis include 1985 and 1995. I would expect the cycles of Marin real estate would become more evident in this way.
Post a Comment