 Here
Here is an article that discusses how to properly interpret foreclosure statistics in order to determine whether foreclosure activity is due to economic conditions. (I sure wish I knew which Northern California county the graph is for.)
If you are watching foreclosure news for clues on the housing market and economy, there are three key things you need to know. While foreclosure activity is rising it remains at historically low levels. Foreclosure statistics can be misleading as a housing market health and economic indicator because there is a base rate of foreclosure that has little to do with the economy or the housing market. Finally, the foreclosure information we really need to make economic assessments isn’t available.
On the first point, RealtyTrac, DataQuick and others have reported a 28% year over year increase in foreclosures for Q1 2006. While this is a significant up-tick, foreclosures are still low. DataQuick which has been tracking foreclosures since 1992 says that California foreclosures, for example, peaked in Q1 1996 at 59,897. In Q1 2006 there were 18,668, less than 1/3 of the peak. These data taken alone support the popular press notion of a “soft landing” for housing, as this level of foreclosure can easily be sustained without itself causing much impact on the market.
The problem with using these numbers alone to measure the state of the real estate market is that most reported foreclosure numbers only represent the first step in the foreclosure process, not the actual number of properties that are foreclosed on, that is, sold at auction. Only around 5% of homes that start the foreclosure process end up foreclosed on. The rest resolve it other ways.
A relatively easy method is to separate homes purchased by 3rd parties (typically indicates sufficient equity to profitably resell) and those that receive no bid and go back to the lender (insufficient equity to resell).
For example, look at the following chart for a county in northern California:
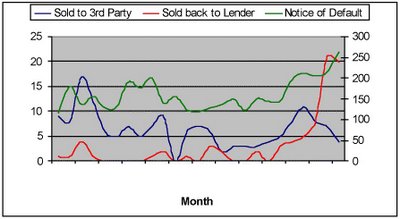
[Regarding the graph, above] While the number of Notices of Default is clearly trending up, it remains low and un-alarming by historical standards. Same for the total number of properties sold at auction. However, the number of properties sold back to the lender (due to lack of equity) far surpassed those sold to 3rd parties for the first time in four years in April 2006. I believe this to be a far more telling leading indicator than any other foreclosure statistic, yet it is presently unavailable from the current foreclosure data sources.
Note: Based on my reading of the article, the abscissa in the above graph should be labeled as "year" not "month".
 Here is an article that discusses how to properly interpret foreclosure statistics in order to determine whether foreclosure activity is due to economic conditions. (I sure wish I knew which Northern California county the graph is for.)
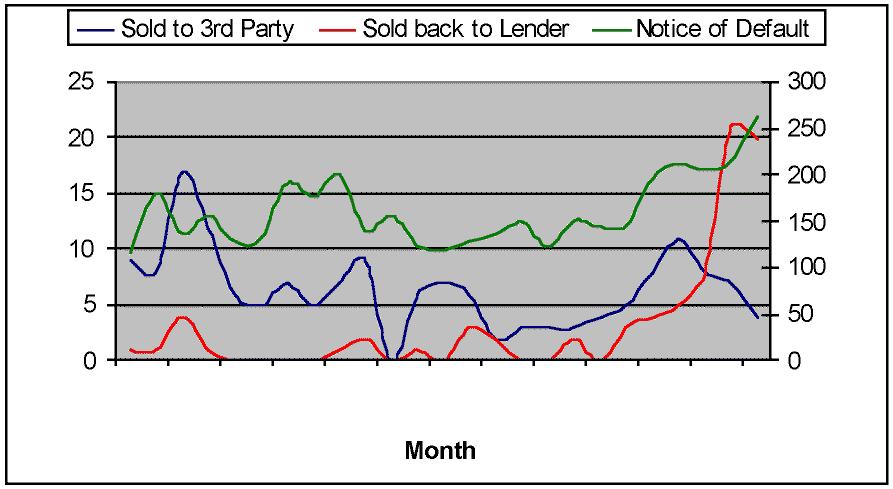
1 comment:
National Hard Money Conference hosted April 30th call 858-736-7788 for info or view 3hardmoneylenders . com
Post a Comment