 I noted previously that the Marin Market Heat Index hit an all-time low of 0.52 a few days ago. The realtor who is the keeper of this index made an interesting point that confirms some of the data compiled on this blog: namely that like other bubble markets that are cooling in California, Marin's inventory is very high (+70%) compared to normal for this time of year.
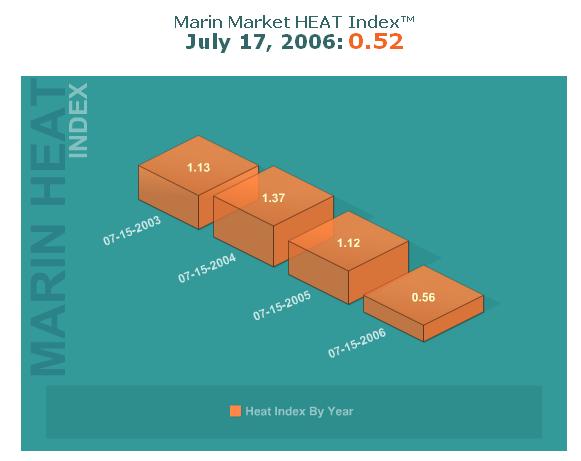
Why have so many houses been coming on the market here in "God's country" where 'everyone wants to live'? Is it just that some sellers have heard a distant rumor about a possible housing bubble (or was that a souffle? It's so hard to keep the real estate industry's euphemisms straight) and so are testing the market and won't seriously entertain offers? Have more people than normal become fed-up with Marin and decided to bail all at once? Is it maybe because there has been a lot of speculative buying in Marin and we are seeing some of that speculative inventory come on the market?
The Marin Market HEAT Index reached a record low reading of 0.52 on July 17. This is the lowest Marin Market HEAT Index reading for the county since the inception of the Index in 2002. By hovering between 0.52 and 0.56 for the past ten days, the Index is mirroring the undeniable realities of our current Buyers Market environment.That's the interesting and informative part. The only point that I take exception to is the description of today's market as a "buyer's market". As explained in a previous post, this market is best described as a "procrastinator's market"...patience will be rewarded.
Record cool readings for the County—you would expect the number of home sales to be dropping like a heavy anchor, right? A close look at the Marin HEAT Index data reveals that the volume of sales closed in the last three months has actually been remarkably stable, declining only fractionally. So, as counter-intuitive as it seems, sales volume is not a factor in the cooling of the market.
What has changed about the Marin market is the flood of active listings. Active listings are up more than 70% during the past three months. So, while the number of buyers has stayed relatively stable, the number of sellers has soared.
To be clear:
1. The overall Marin market is very cool;
2. The volume and pace of home purchases is virtually unchanged in the three months since the highest 2006 MMHI reading three months ago; and
3. The listing inventory has grown hugely in this same short period of time.
Take a look at the Closes and Listings numbers comparing April 15, which had the highest HEAT Index number so far in 2006 (0.96), to July 17 which had the lowest Index (0.52). Nothing more is necessary to understand the reason for the cooling off in the market:
Market Activity April 15 (Warmest) July 17 (Coolest) 30-Day Closes 236 235 Active Listings 619 1,067
The rest of his discussion is a pathetic round-about plea-based argument asking people to buy. His reasons for not buying seem to have been selectively taken from this blog. I guess he is either honoring this blog or disparaging it in a round-about way. Sigh, I'm sure it's the latter. I guess he wasn't too happy with the email I sent him complaining about his back-peddling statements in his last "Discussion & Analysis" about how the Heat Index is a "relative concept" and the Index is not as bad here as it is in Sonoma and other points north. Needless to say, I'm not expecting a reply.
So now would be a good time for some data.
The first chart shows the number of SFRs on the market at various points in time according to ZipRealty. (For both this and the next graph I determined the number of SFR by searching for all houses of any size and with any amenities falling within the asking price range of $100,000 and $10,000,000.)
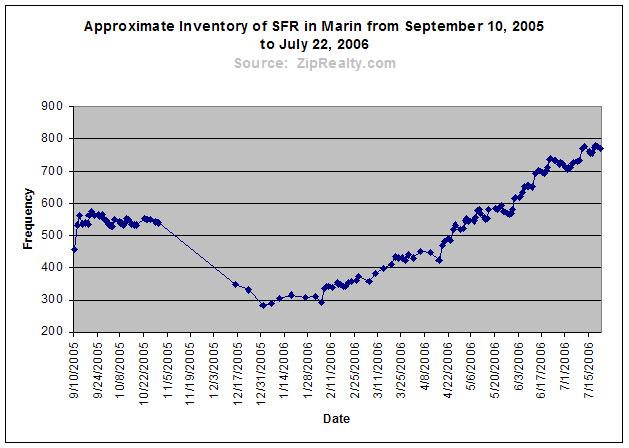 Note: The reason for that long, downward sloping straight line in the chart is simply because I had stopped collecting the data during that time span; I got so bored with data that was not changing (flat) that I stopped recording it and only resumed once I noticed that something interesting was starting.
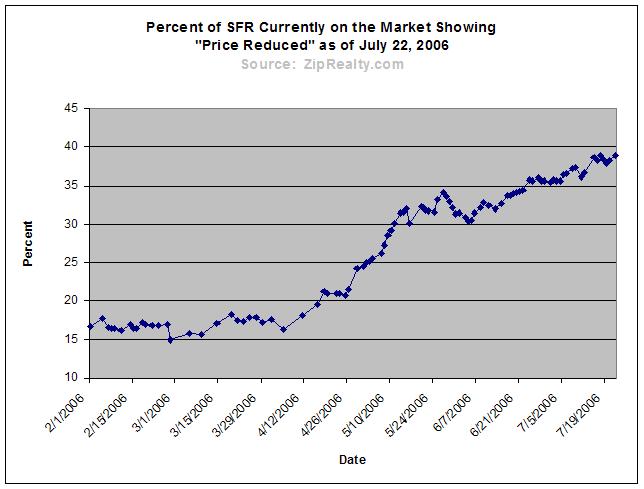
The second chart is one you have seen before but updated to be current -- the number of SFRs showing "price reduced". As you can see, we "kissed" the 40% mark and then backed off from it.
Now, after you have read all that, check out this brilliant post over at the Southern California Bubble Crash blog. The same thing could be said about Marin and in fact I may repeat that analysis for Marin (or better yet, how about a reader make the post?).
It's over 100 degrees in Mill Valley today and so I'm off to the pool to cool off.
2 comments:
People seem mystified by the exploding inventory. No mystery here. People are smarter than realtors give them credit. Just like low interest rates and loose lending frontloaded a raft of buyers, the coming declines are frontloading sellers. If you were planning on cashing out or even just moving anytime in the next 1-3 years and you know the market you'd be selling now rather than risk having to sell in 2009.
"heard a distant rumor about a possible housing bubble"
Amongst family residing here, that's all the "bubble" is, a rumor of trouble brewing elsewhere, certain to bypass us. Doesn't it sound classy to say you're above those economic realities, whether it's true or not? This was the conclusion of tonight's dinner conversation, which suggests to me many homeowners won't know what hit them. People do have smarts, unless their future plans depend on that extra $1M in appreciation.
Post a Comment