 As I've been rather busy of late and frankly there is not much else that needs to be said vis-à-vis the housing bubble my rate of postings has slowed and will probably on average remain slow.
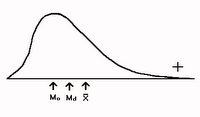
But I did find this posting (the July 29, 2006 entry) over at the Charles Hugh Smith Blog worth highlighting as it does a pretty good job of explaining something that I've previously referred to but never went into any detail to explain because I thought it was fairly self-evident from the Marin data that I've already posted (e.g., this); anyone with a basic understanding of statistics and the bell-curve probably already realized this. It explains how the median sales price of a housing market as a whole can go up while the sales price of individual houses comes down. At this point in time (the transition from an insane seller's market to a buyer's market [only the future will tell how insane the buyer's market gets]) the median sales price is more a measure of the mixture of houses that sell than a measure of individual value.
Whenever I have a (real estate) question I cannot get answered, I turn to Bob [Casagrand, realtor].This effect can easily be seen in the recent Marin data where we get such absurd (as in 'ridiculously incongruous') appreciation rates for houses in Tiburon/Belvedere (+42%), Mill Valley (+26%), or Bolinas (+229%) even while prices are reversing. It takes 6-8 months for a change in interest rates to begin affecting the market and those effects first show up in the lower priced houses.
So I asked him, Why is the median rising, when each individual home is selling for less? Actually, most San Diego homes are back at 2004 prices.
Bob told me that the under $400K buyer is squeezed out due to rising prices and higher interest rates. The high end is holding up a little better, because the ripple effect has not yet made it to the high end, and the low end has weakened MORE than the high end.
Last year, the +$1million home was 8.5% of sales. This year it is 10%. This is skewing UP the distribution of homes sold, raising the median, although each home, including the high end homes, are selling for 10-15% less today than last year.
We are selling proportionally MORE of the expensive homes, and the median tells us only about the MIX of homes sold.
It does not tell us about the value of each home. The $1.1 mil house was worth $1.5 mil in 2004, so it has also gone down in value.
If you want to know how each house has held up, you have to use the Case-Shiller index, or the OFHEO housing price index. Both track the SAME house over time, giving us the change in valuation of each house instead of the change in the MIX of homes sold.


